Is social media marketing better than traditional marketing?

This post is a response to a question initially posed on Quora, and can also be accessed via “https://www.quora.com/Is-social-media-marketing-better-than-traditional-marketing/answer/Antonio-Amaral-1

Marketing is a process of leveraging communications within an ecosystem.

Marketing must continually adapt to changes in an ecosystem to be effective.

Direct mail was an effective marketing strategy fifty years ago because there were few (relatively) inexpensive alternatives then. Radio, television, and national magazine advertising were pretty much the only other primary marketing channels that could get national reach for one’s brand, and those are (and were) expensive marketing strategies. Otherwise, one would have to place ads in local publications like newspapers, quickly becoming costly when scaling up nationwide by buying space in hundreds of publications.

Then the Internet arrived, and one could gain national and international reach for almost free.

Almost overnight, what worked steadily and unpredictably no longer did. The traditional market became prohibitive and ineffective as alternative media sprouted up everywhere.

Marketing has always relied on establishing trust with its consumers to create sales. So, relationship marketing became more focused on social media because a two-way, one-to-many dialogue was made possible.

Before then, marketing was mainly defined as a one-way, one-to-many communication.

The downside, however, has been such a low entry bar that everyone and their dog could compete on an almost level playing field.

A small operation could get international reach as effectively as a large corporation. That forced corporations to up their game. A saturated media market meant more comprehensive and audacious strategies for attracting attention.

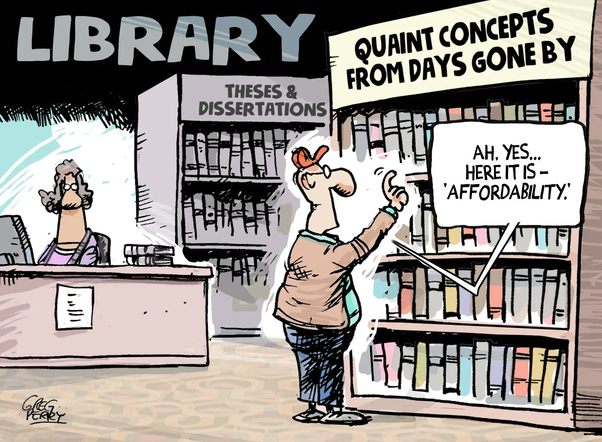
Now, we have reached a point where advertising is starting to turn people off, and it’s become difficult to pinpoint effective marketing strategies because advertising has become a reason for people to avoid rather than be attracted to a brand.

Even the “give away something for free to attract people” has been losing its lustre. For example, being asked to register one’s email address and personal information to access an article is losing its harvesting effectiveness in a world where people create “junk-catching email addresses” to avoid spam.

There is no “better or worse marketing system” in a constantly evolving world. There is only staying ahead of the “pissing people off curve” and hope to make lasting connections that one can leverage for sales.

The only thing that does not change about marketing is the need to build relationships based on trust because that’s core to the human condition.

Getting attention is easy. Converting that attention into closed deals is an entirely different ballgame.

Why don’t newspapers use more graphs with their articles?

This post is a response to a question initially posed on Quora, and can also be accessed via “https://www.quora.com/Why-dont-newspapers-use-more-graphs-with-their-articles/answer/Antonio-Amaral-1

A straightforward answer is that visuals are a LOT more time-consuming to create and fill a space than words.

What can be conveyed within a couple of paragraphs, taking only a few minutes to compose, can require at least an entire day of effort to create an infographic that depicts the same information.

Much of the reasoning for the judicious use of illustration is the cost and time required to prepare.

Newspapers are daily publications, so there is little time dedicated to comprehensive illustrations that can fill a page and convey what can be expressed through words. A daily cartoon for a cartoonist is a full-time job for a reason.

Weekly and monthly magazines have more freedom to include more visuals in their publications, which do attract more people and appeal to broader audiences, but they’re also more expensive.

Although graphs aren’t quite as time-consuming to create because many programs can generate attractive graphs from data, this is where the time-consuming challenge rears its costly head. Gathering data and refining it sufficiently to create a graph that complements an article can be beneficial if the story is data-intensive. Still, most stories are information-rich narratives that don’t translate into data parsing visuals.

Infographics are about telling stories, but creating them can involve several days of effort.

The (mostly very short) articles I compose here, which I further tweak and publish elsewhere and include illustrations, can take as long to create as the 2-minute-long article I write. I begin with an AI-generated image, which I then process through photo-editing tools that are sometimes composites of multiple AI originals. If I were to create illustrations from scratch, that would require a bulk of one day (4–6 hours) of cartoon-style illustration for an article I would have spent two to three hours composing.

An infographic would require research in compiling data, research in identifying appropriate images to use (because it’s often faster to find glyphs to modify than it is to create them from scratch) and then arranging all of that into a pleasing visual that’s easy to follow is an evolutionary process that often requires moving stuff around to make everything fit in a way that guides a viewer’s attention. In short, it’s just more work to create an infographic. Creating unique and attractive infographics that clients want to pay good money for is a market on its own that I’ve thought of exploring at different times in my life but haven’t done so earnestly… and I kick myself for that because I’ve taken the notion of infographics much further into something I’ve called an edugraphic — which is essentially an entire course within a single graphic.

Here’s an example of one visual I created around David Kolb’s Experiential Learning Model — this took more than a week to develop (this was part of something I was working on before my life was upended) — in essence, this is a self-contained course within a single graphic which I refer to as an “edugraphic” rather than “infographic”: